Visual Intelligence Portal (VIP)
supporting
SmartLists® with SmartAlerts®
including SoftStops®,
webHeatmaps® and NASDAQ Level
2 Quotes
A downloadable Microsoft™
Word version of this document is at:
http://www.wirelessmarvels.com/~vip/vip.doc
If you are a new subscriber and wish to quickly set up SoftStops®
without having to review this detailed manual,
then use the Quick Start Guide at:
http://www.wirelessmarvels.com/vipquickstartguide.doc
1.0 Introduction to the Visual
Intelligence Portal (VIP)
2.3 Logging On to the VIP
Service
3.5 Setting SmartAlert
Preferences
3.7 Setting Limit Alerts and
Showing Limit Exceeded
3.8 Setting SoftStop Alerts and
Showing SoftStop Reached
3.9 Launching webHeatmaps,
NASDAQ Level 2 Quote Viewer, and Help
4.1 Summary of Benefits of
WebHeatmaps
4.2 Mouse and Window Control of
webHeatmaps
5.2 Launching the NASDAQ Level
II Viewer
1.0 Introduction to the Visual Intelligence Portal (VIP)
 Wireless
Marvels Inc. is pleased to introduce you to the Visual Intelligence Portal
(VIP). This is a Web-Based subscription
service offering of integrated web tools aimed at providing individual and
institutional traders with a wealth of online real-time financial market
information in an easy to comprehend visual format. The subscriber’s Web browser, used to connect to the service, is
securely downloaded with multiple applets (small remotely loaded applications)
to provide for various types of data displays and analysis.
Wireless
Marvels Inc. is pleased to introduce you to the Visual Intelligence Portal
(VIP). This is a Web-Based subscription
service offering of integrated web tools aimed at providing individual and
institutional traders with a wealth of online real-time financial market
information in an easy to comprehend visual format. The subscriber’s Web browser, used to connect to the service, is
securely downloaded with multiple applets (small remotely loaded applications)
to provide for various types of data displays and analysis.
The primary service
offering is a dynamically updating portfolio, known as a SmartList, displaying
a number of different critical parameters and charts for each security. The subscriber may program each SmartList
security with one or more SmartAlerts. If a SmartAlert is activated because of
current market conditions, whether the subscriber is currently logged into the
service or not, they can be notified of the Alert via a combination of Email
and messages sent to their wireless devices. One particular SmartAlert is of
particular interest to traders who follow the trailing stops philosophy. The
“SoftStop” SmartAlert automatically maintains subscribers trailing stops and
alerts them via Email and/or wireless devices when a critical stop point has
been reached.
The webHeatmap offering
provides an unprecedented manor of displaying market conditions via a
specialized color-coded display that allows a trader to simultaneously view
hundreds of securities or portfolio positions, and quickly hone into those that
have reached conditions that warrant further examination by the subscriber.
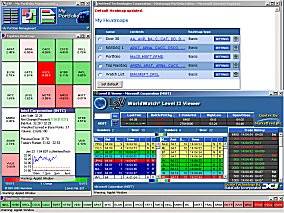 With the NASDAQ Level II Viewer, you can
view real-time supply and demand information for any Market Maker driven equity.
You can gain an unprecedented insight into the minds of those controlling the
market. You can use it to take advantage of the minor price differences between
the bid/offer spread to capture profits or you can use it to time your entry
and exit points used in momentum trading strategies.
With the NASDAQ Level II Viewer, you can
view real-time supply and demand information for any Market Maker driven equity.
You can gain an unprecedented insight into the minds of those controlling the
market. You can use it to take advantage of the minor price differences between
the bid/offer spread to capture profits or you can use it to time your entry
and exit points used in momentum trading strategies.
This is not a static
service offering. The development team will be periodically releasing upgrades
and enhancements to the current offerings, new value-added optional services as
well as offering additional types of SmartAlerts.
Because this is a
Web-based service, subscribers may access the service from anywhere on the
Internet. No information is maintained on local computers used by the
subscriber. All subscriber specific information is maintained in online databases
maintained at the centralized server farm of redundant scaleable computers that
operate the service. All information transferred to the subscribers computer
used to access the service, is sent in a secure encrypted form, so that no
outside parties are able to determine what information is being viewed or
analyzed by a subscriber. For added security, the service also employs “
Digital Signature Technology “ (Class
3 for Commercial Software Publishing) and “Object
Signing” licensed from VeriSign, to insure that the specialized software which
is downloaded from VIP’s servers to the subscribers computer, has not been
tampered with, and to insure that this software is granted proper privileges to
operate properly on your computer.
2.0 Accessing the Service
2.1 Prerequisites
Before you can start using VIP you must have the
following:
- A
valid VIP account that is established through the online registration
process. You will need your
assigned User ID and Password to log onto the service.
- Workstation
running either IE 5.5 (or higher) or Netscape 6.0 (or higher).
- Internet
access. We highly recommended a
DSL, Cable Modem or T1 connection for the satisfactory performance of all
real time updates.
- One
or more Email addresses of electronic mailboxes and/or the Email addresses
associated with a pager, cellphone, PDA, wireless Palm, Blackberry, or
other device, for SoftStop and other SmartAlerts.
2.2 Registration
Process
In order to access the
Visual Intelligence Portal, a User ID and password must first be established.
This information is defined during the registration process where an individual
or corporate user establishes an online account. There are several steps in the registration process. They are as
follows:
Personal information The subscribers name, address,
telephone, fax number and Email address is requested as well as any company
affiliation
Selecting a Service Plan The various service
plans and options are discussed and the subscriber chooses the initial plan.
This can be upgraded or downgraded at a later time.
Service Agreement The VIP Service Agreement is
presented to the subscriber. This explains how the service operates, defines
how closing prices are established, how Alerts are handled, the importance of
using multiple Email addresses for Alerts, and other important operational and
contractual issues. This agreement should be printed out, read and signed
online.
Exchange Agreements The NYSE, AMEX and
NASDAQ Exchange agreements are each presented to the subscriber. Each must be
signed before continuing the registration process. The agreements explain the
restricted license you are being given to view and utilize up-to-the-second
market data.
Secure Credit Card A credit card is
required to sign onto the VIP service. All credit card information is collected
and stored in a secure manner and authorized using secure services. But, if
there is any insecurity regarding the use of credit cards over the Internet,
the registration process can be completed via telephone.
2.3 Logging
On to the VIP Service
To start the VIP
Service, from your browser enter:
http://vip.netfeedtech.com/smartlist/
The following window is displayed:
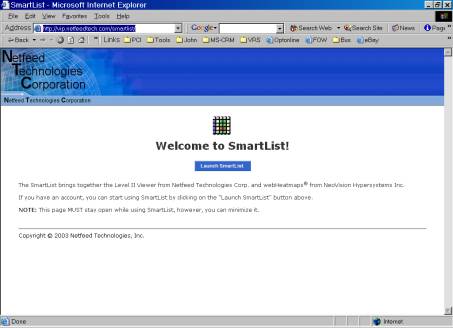
Select Launch
SmartList. A screen asking for verification
that you are allowing a secure web application to operate may appear. If so, select Yes to allow the applets (small application temporarily loaded from
our servers onto your computer) to operate normally on your computer.
The following login screen is displayed.
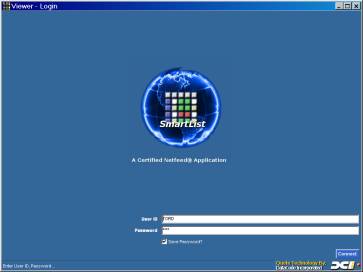
Log into VIP by entering your assigned User Id and
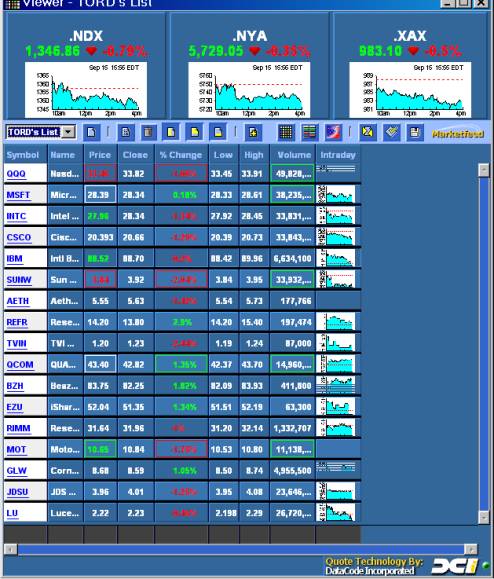
Password. Then select the Connect button. The main SmartList display of the VIP
service will appear in a similar manor to the following:
First
time users:
Setup your portfolio first by
entering a few securities. This is a
good way to start understanding how VIP works before entering all the
securities in all of your portfolios. Press the “ Add List Entry ” button to add
a security to the portfolio SmartList being displayed.
3.0 SmartList Portfolios
3.1
SmartLists
A SmartList is a real time portfolio and quotation
viewer. VIP allows each subscriber to
create one or more portfolios and to define what parameters associated with
each security symbol should be displayed.
Dragging the columns left and right to set their desired width makes the
information associated with each parameter easily viewable.
During market hours, this SmartList is dynamically updated
with any change to price, volume, high, low, percentage gain, or percentage
loss as it occurs in real time. Current
up-to-the-minute market data is feed into the servers that operate the VIP
service so as to keep the data accurate up to the second. As the VIP servers
receive more up to date information for a subscribers particular subset of
securities, that data is immediately transmitted to the subscribers computer to
update their SmartList display.
SmartList provides the following functions:
- Display
real time security information for a user portfolio.
- Create
and maintain user portfolios.
- Activate
particular SmartAlerts for a security and to set the parameters associated
with that type of alert.
- Define
SmartAlert notification Email addresses.
- Set
up to receive daily or weekly reports from VIP.
- Launch
webHeatmaps and Level 2 Quote Viewer, if these optional services are
available.
- Launch
the Help service that provides VIP Support Services: contact form for customer support,
Frequently Asked Questions (FAQs) list, and the User Guide.
3.2 SmartAlerts
The SmartAlerts is the monitoring service for
SmartLists. SmartAlerts allows the
subscriber to set optional parameters on one, several or all of the symbols of
any portfolios managed by SmartList.
There are two types of SmartAlerts currently provided although many
additional ones will be forthcoming:
- Limit
Alerts
- SoftStop
Alerts
3.2.1
Limit Alerts
Limit Alerts allow the user to set specific upper and
lower price limits for any security in the user’s portfolio. Any time of the
day that the current price exceeds the upper limit or is below the lower limit,
a SmartAlert is generated. It is not necessary for the subscriber to be logged
in for SmartAlerts to function. Once the parameters are set, VIP continually
monitors securities.
Note: In the initial
release of the VIP service, Limit Alerts will only be displayed graphically in
real time, while viewing the SmartList having the limits set. Off line
monitoring of limits with Email alerting will be in a subsequent release. Out
of limit indicators will appear through the display of the ticker symbol in
color. When the ticker symbol is GREEN an upper limit has been reached, while RED indicates that a lower
limit has been exceeded.
3.2.2 SoftStop
Alerts
SoftStop Alerts
implement a “trailing stop” philosophy that is designed to limit losses before
they become major losses and to allow gains to accumulate while protecting the
trader from a sudden price drop. A SoftStop is set by specifying the percentage stop-loss
that is tolerable, and setting the original purchase price of the security
being monitored. An alert is generated
at the end of any day when the stop-loss limit is reached. So, for example, if
the subscriber set a 20% SoftStop on a security that was originally $100, then
a SmartAlert would be generated on any day when the closing price was below
$80. But, on the other hand, if the security went up to $160, a SmartAlert will
be generated if the end of day price drops below $128. Optionally, the
subscriber may set a specific SoftStop price. So using the same example, if the
SoftStop price was set to $88 and the security went up to $160, the SoftStop
price would be automatically adjusted by the system to $140.80 which is the 12%
limit as calculated when the $88 price was set on the $100 security.
3.3 SmartList
Display Options
The SmartList displays a
list of stocks in a SmartList portfolio along with one or more optionally
displayed parameters. Control of the
SmartList appearance is as follows:
- Order of the parameters
- Changed by dragging the column names
to the left or right.
- Set the column width
- Dragging the side of the column name left and right adjusts
the size of each column.
- Snap Columns to Fit Window
- Attempts to fit all field data on the
current display screen, adjusting column widths as necessary.
- Right Click for Parameters
- A right click on any field name
provides the user with a list of possible parameter fields that may be
added.
Only one SmartList
window is viewable at one time.
The parameter fields
associated with a security instrument include:
- Ticker Symbol and Security Name
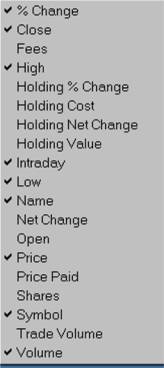
Fields may be added and
removed by a right click on any column and checking which column names are to
be included in the display.
Show or Hide
Cells (Rows of Securities) Summary Rows Display Chart Options Display News Launch L2 Edit Parameters Remove Entry Row Headers
![]()
![]()
![]()
![]()
![]()
![]()
![]()
![]()
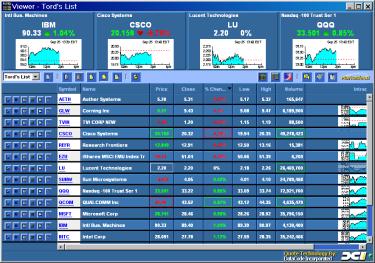
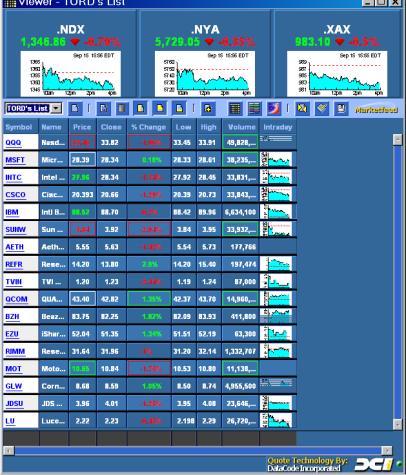
Across the top of the display the user may select
particular charts and values to be continually displayed. In the prior example
three indices are being shown while this next example shows 3 securities and an
index. The charts are controlled as follows:
Charts Right Click Chart
to display chart options. Right Click icon
bar to display “Add Quote” to display a new chart.
![]()
![]()
Charting Options are:
Right
Click icon bar:
Displays “Add Quote” to add a new chart.
Right
Click a chart: Selects
chart options:
Add Quote display
new chart
Edit edit
this securities SmartList parameters
Remove deletes
Chart
Chart displays
analytic charts
Options displays
options for security
News displays
news for security
Level II for NASDAQ securities displays Level
II view
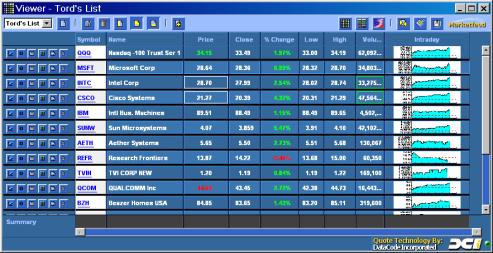
If a SoftStop SmartAlert is set for a security,
the subscriber has specified the original purchase price of the security. With this
additional information, VIP may display the current price in a
color-coordinated manner to quickly provide value-added information as follows:
Green The
current price exceeds the original purchase price and above yesterdays close.
Blue The
current price is above the original price but is below yesterdays close
Yellow The
current price is below the original price but above the SoftStop Price.
Red The
security is trading below the SoftStop price.
3.4 Portfolio
Management
The services for creating, editing and removing
portfolios and portfolio entries are shown in the following figure. A maximum
of 10 portfolio SmartLists may be defined:
Add List Entry Remove List (Portfolio) Edit List Name Create New List
(Portfolio) Select Portfolio


![]()
Right
clicking a row for a security: displays the following options:
Add Entry add
a new entry (security) to the list
Edit edit
this securities SmartList parameters
Remove deletes
Chart
Chart displays
analytic charts
Options displays
options for security
News displays
news for security
Level II for
NASDAQ securities displays Level II view
3.5
Setting SmartAlert Preferences
A SmartAlert
notification is Email report which is generated and transmitted when one of the
Alert Types specified for a security have reached the point where the
subscriber should be notified. The VIP service can send one or more Email
messages when this event occurs. Today, nearly all wireless devices have an
Email address associated with them for the purposes of sending a short or long
message or to the device. This includes pagers, cellphones, PDA devices,
Blackberry/RIM pagers, wireless Palm devices, and many others. Contact your
service provider to find out what Email address can be used to display an Email
message on your particular wireless device.
SmartAlerts are used to
notify the subscriber when certain events occur for a security. Because of the
importance of such a notification as well as the potential unreliability of the
delivery of an Email message, it is recommended that SmartAlert notifications
always be directed to at least two different Email addresses. In that way,
there is a higher chance that at least one of the Email messages will reach its
destination. An Email message might not reach an Email box for any of a range
of different reasons including - it is found that the subscribers mailbox is
filled, or the route to the subscribers Email server has been temporarily
blocked, or a hacker has bombarded the Email server with so much junk mail that
the server is unable to receive legitimate Email. In the case of a wireless
device, a received Email may come to the wireless service provider but the
wireless device is in an area where the message cannot be delivered, or it is
off, or the device might be in an analog service area where digital messages
can’t be received. By sending to multiple Email addresses, there is a higher
probability that at least one copy of each important notification will be
received.
Selecting
the Preference button sets the SmartAlert parameters for all securities. The Preference window is displayed with
fields for:
- Email
message type: HTML or Text.
Default is HTML.
- Email
Addresses to send Alert and Reports:
up to 5 email addresses may be entered
- Send
Test Email button – when clicked a test Email message is sent to the Email
addresses associated with the subscriber in order to insure that this
message is properly delivered to Email boxes and wireless devices that may
have been specified.
SmartAlert
Email messages will report the security and the alert type being reported upon
and the parameters that have caused the notification to be generated. Each
Emailed report contains a segment that includes optional information included
from the developers and operators of the VIP service to convey additional
information with regard to Alerts.
3.6 Emailed
Reports
In
addition to SmartAlert parameters, the Preference display allows the subscriber
to specify if they would like portfolio reports to be sent to their Email
addresses on a daily or weekly basis. Daily portfolio reports contain an End of
Day summary with the days closing information. Weekly reports only report
positions as of the end of the week. If SoftStop Alerts are in effect, SoftStop
information is included in these reports.
Each
Emailed report contains a segment that includes optional information from the
developers and operators of the VIP service to convey some of the latest
available service information to subscribers.
This might refer to new features and functions being offered or answer
frequently asked questions.
3.7 Setting
Limit Alerts and Showing
Limit Exceeded
Limit Alerts allow the user to set upper and lower
price limits for each security in the user’s portfolio. Selecting the Edit Parameters button on the
entry row associated with the security sets the limits. Another window is displayed with fields for
entering the upper and lower limits.
The “Symbol Field”
changes text color to GREEN
if the upper limit is reached and RED if the lower limit is reached.
3.8 Setting
SoftStop Alerts and Showing
SoftStop Reached
SoftStop Alerts are activated by specifying the
percentage stop-loss desired, and the original purchase price of the security
being monitored. An alert is generated at
the end of day when the stop-loss limit is reached.
The service requires that the subscriber specify the Email
address (or addresses) where alerts should be sent. This may be a real Email account, the address of a wireless
device such as a one-way or two-way pager, text messaging cell phone,
Blackberry device, wireless Palm, or similar type of device. The subscriber may further select to have
their portfolio Emailed to them each day, at the end of the week, or never. If
the portfolio is emailed, it will contain the current stop-loss point of each
security being monitored, based upon the rise in price above the purchase price
or the fall below the original price.
Regardless of the Emailing of the full portfolio, on the evening after
the market closes below a stop-loss point, a SmartAlert is Emailed to the
subscriber to indicate that they may wish to put in a market or limit order the
next trading day.
Selecting the Preference
button sets the SoftStop parameters for all securities. The Preference window is displayed with
fields for:
·
SoftStop Default Percentage (Stop-Loss) to be used
for all securities unless changed or disabled for a particular security.
- End of Day or End of Week portfolio
reports may also be selected from the Preferences display. These reports
also include information with regard to any SoftStops they are active
against a particular security.
Selecting the Edit
button for the individual security sets the SoftStop parameters for that
particular security. Another window is
displayed with fields for:
- Set alert type: SoftStop Alert enabled or
disabled. Default is disabled.
- SoftStop percentage (Stop-Loss) for
this particular security.
- Original purchase price.
- Enable/disable triggering SoftStop
Alert Notification
- View / Hide SoftStop Price on entry
display
3.9
Launching webHeatmaps, NASDAQ Level 2 Quote
Viewer, and Help
 The
buttons for launching webHeatmaps, the NASDAQ Level 2 Quote Viewer, and Help
are shown in the following figure:
The
buttons for launching webHeatmaps, the NASDAQ Level 2 Quote Viewer, and Help
are shown in the following figure:
Launch Level 2 Quote
Viewer Launch webHeatmaps
for Portfolio

![]()
4.0 Heatmaps
"A
picture is worth a thousand words".
Never has that saying had more meaning than with webHeatmaps. In a single glance, the user can differentiate
market movement like never before. The
Visual Intelligence Portal (VIP) translates your individual portfolios into
colorful webHeatmaps
automatically.
“People are over-saturated with
information … there will be a paradigm shift to glance-ability” – Kevin Brooks
– Motorola Research
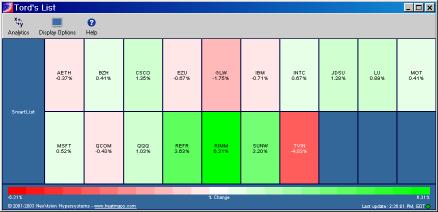
A Heatmap is a visual
representation of an entire portfolio in one shot. In a single glance, the
subscriber may differentiate market movements like never before. It organizes
financial instruments or positions into color-coded cells or spots that report
some key information regarding the security. Using live data, Heatmaps perform
calculations in real-time and displays the results in color. It is called a
heat map because it quickly shows what is hot and what is not so that the
subscriber may focus their attention where it is most needed. The VIP utilizes
the “mouse-over” feature on top of the Heatmaps so that an entire summary of
live data is presented to the subscriber merely by putting the mouse over any
box of the Heatmap. The Heatmap can be shrunk into a corner of the trader’s
screen leaving only the color codes to be seen. If the subscriber sees the
minimized diagram starting to turn redder or greener they can quickly enlarge
the diagram to view details. Reading raw numbers in a SmartList or within a
spreadsheet requires much time and attention by the subscriber. But leaving a
Heatmap on the screen allows the subscriber to do other things on their
computers while utilizing visual color clues to determine when they should
examine details. Heatmaps, although simple in concept, are a productivity and
management enhancement tool that quickly becomes an invaluable.
Users can set visual alerts to highlight important opportunities,
critical information or current results.
WebHeatmaps
allow the user to focus their time and attention on the few pieces of
information that are most important at this moment.
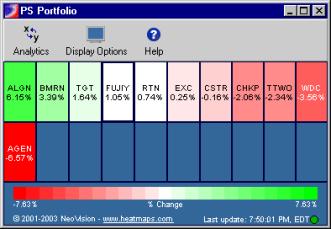
This 11 security Heatmap is ordered by percentage gain or loss
since yesterdays close.
4.1 Summary of Benefits of WebHeatmaps
The WebHeatmaps application provides a consolidated map to all the information
required by investors in the decision making process. These benefits include:
·
Immediately
target, analyze and act on market changes.
·
Display
hundreds of positions or securities simultaneously. The intuitive visual
interface makes sense immediately.
·
Portfolio or
position performance to relative benchmark
·
Perform
better executions by spotting opportunistic conditions Find financial
opportunities that would otherwise be lost in a sea of important data, and
reduce your risk.
·
Detailed
numerical information is available with just one click.
·
Easier. Focus
only on the few pieces of information that are most important at any given
time.
4.2 Mouse and Window Control of webHeatmaps
The following is a list
of the Mouse Actions supported by webHeatmaps:
Mouse-Over
By placing the mouse over any
particular cell in a WebHeatmap, users can gain insight into the price movement
by viewing important information such as: Last Sale, Net Change, Today’s High,
Today’s Low, Volume, Previous Close and a dynamic tick chart on today’s
activity.
Right Click Cell -View News, Options, Fundamental Data
and Charts
-Return
to SmartList view
-Set
Reference Cell, color and value
-Set
Reference Cell, color
Left click cell For NASDAQ listed securities,
simply click on the instrument to view real-time NASDAQ Level II data.
Resize Window webHeatmaps
can be reduced to a very small window to monitor your
portfolio while other programs are active.
The information shrinks to only where the color of the cells is
visible. A mouse over a cell then
displays current information for the security.
The Set
Reference Cell (Color and Value) item allows the current cell (the one
below the cursor) to be the reference cell that all other cells are relative to. The color is set to “white” and the value in
the cell is to a reference value depending on the cell value being
displayed. For example, if % Change is
being displayed then the reference cell is set to 0%.
The Set Reference Cell (Color) item allows the current cell (the one below the cursor) to be the reference cell that all other cells are relative to. The color is set to “white”.
4.3
Setting up a webHeatmap
The services shown on and selected through
the menu bar are:
·
Analytics
·
Display
Options
·
Help

Menu Bar
![]()
Analytics
– The menu
selections are:
|
Resort |
Reorganize the cells
after market activity changes the order of securities as per the ColorBy
value. |
|
Sort
Ascending |
Sort the cells in
ascending order based on a selected value (see Values) |
|
Sort
Descending |
Sort the cells in
descending order based on a selected value (see Values). |
|
Color
By |
Select the color value
(see Values), |
Values:
|
% Change |
Open |
|
Close |
Price |
|
High |
Shares |
|
Low |
Trade Volume |
|
Market Value |
Volume |
|
Net Change |
|
Display Options – The menu selections are:
|
Show
Labels |
The business segment
column is displayed. |
|
Show
ColorBar |
The gradient color bar
is displayed. |
|
Packed |
The securities are
divided into business sectors. Only
valid if the securities are in multiple business sectors |
ColorBar Labels![]()
![]()
Help Online
Help moves the
subscriber to the support VIP web site.
The subscriber can send a query to the VIP customer and technical
support teams, review Frequently Asked Questions, or reference the User
Guide.
About Us presents the current version of the
software and vendor attributions.
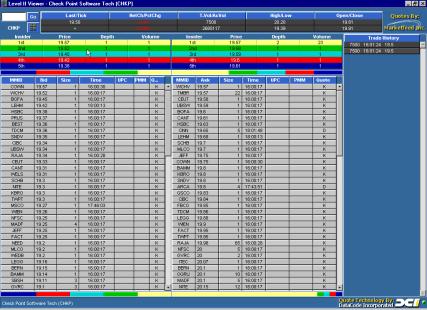
5.0 NASDAQ
Level II Viewer
The Level II Viewer
brings NASDAQ Market Maker information alive by displaying the positions of all
market makers (players) training in a particular security. The Viewer displays
a given security, by color - according to their relative position from the Bid
and Offer at any given time during market hours. It provides the serious trader
with unequaled insight into the bid/offer side of the market from every Market
Maker on NASDAQ and Small Cap Market issues. This information is used by
financial institutions worldwide and is a “must-have” for all professional U.S.
equity traders as well as non-professional Day Traders.
Level II goes a step
beyond Level I (standard quotes). It reveals the “ order book ” for a NASDAQ
stock. It shows the best bid and offer of every market participant who is
publicly posting a quote. It can be used to take advantage of the minor price
differences between the bid/offer spread to capture profits or used to time
entry and exit points used in momentum trading strategies.
The Level II Viewer organizes the NASDAQ Level II Market Maker data on
NASDAQ Securities into color-coded instruments. Using live data, the Level II
Viewer performs calculations in real-time and displays the results as color.
Each color represents the “Amount” of Market Makers present relative to the
Best Bid and Best Offer as well as the total number of shares being offered at
those prices. The Level II Viewer helps to focus time and attention on the few
pieces of information that are most important at this moment and help the user
to visualize the total breadth of trades and open orders for a particular
security.
5.1 Features
Price Distribution Bar The Price Distribution Bar graphically displays the relative number of
Market Makers in each price tier compared to all of the outstanding bids or
offers. It gives the user an idea of what price dominates the market at the
moment. It is located just under the Level I price information (1st
set of vertical color bars).
Volume Distribution Bar The Volume Distribution Bar graphically displays the relative number of
shares in each price tier compared to the total volume of all outstanding bids
or offers. It will help give you an idea which price tier has the greatest
volume. It is located at the bottom of the screen (2nd set of
vertical color bars).
Price Tier A price tier is a group of bids or asks that are at the same price. The
top 5 price tiers are color coded to group them together. For example on the bid
side of the illustration that follows, the 2nd tier (in light green)
shows all bids at the price of $29.44 for Microsoft. The Price Tier is located
in the middle of the screen and is represented by the Horizontal color bars.
Enter NASDAQ
Security Asking Prices by
Market Makers Bids by Market
Maker![]()

![]()
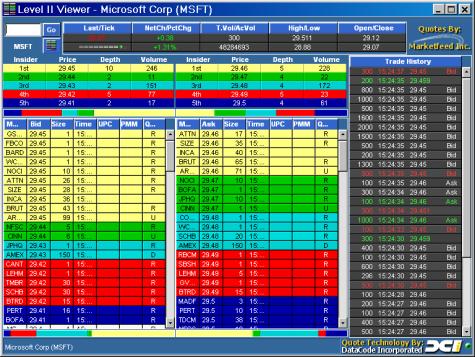
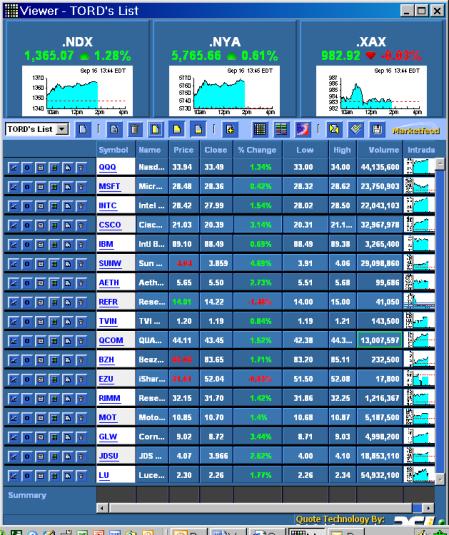
5.2 Launching the NASDAQ Level II Viewer
With VIP you can launch the VIP NASDAQ Level II Viewer directly
from SmartList or webHeatmaps. The following figure shows a typical Level
II display.
6.0 Service Costs
The
basic service offering provides SmartLists with SmartAlerts. The webHeatmaps and
NASDAQ Level II Quotes are optional services that may be added to a subscribers
account at any time. The cost of the SmartList service as well as the NASDAQ
Level II service includes a fee paid directly to the exchanges for the access
to real time data. There is no exchange fee associated with webHeatmaps since
the same exchange data as that used by the SmartLists, is used.
Service Pricing is as follow:
·
SmartList with SmartAlerts $23.95 / month
·
Heatmaps $ 5.00 / month
·
NASDAQ Level II Quotes $38.95 / month
7.0 Acknowledgments
The
VIP service is the combined offering of a number of different technologies
designed, developed, supported and marketed by organizations having a long
history of creating online real time, state-of-the-art data processing and
communication products. The primary development partners include Wireless
Marvels Inc., Netfeed Technologies, DataCode Inc., Marketfeed, Inc.,
Programming Methods Inc. and the licensed products of NeoVision Hypersystems
and VeriSign. Netfeed Technologies Inc operates the customer and technical
support activities as well as operating the Web Servers.